Since v0.1.0 Kermeta has a debugger. As any debugger, it proposes breakpoints step over, step into, run, resume, visualization of variables, etc
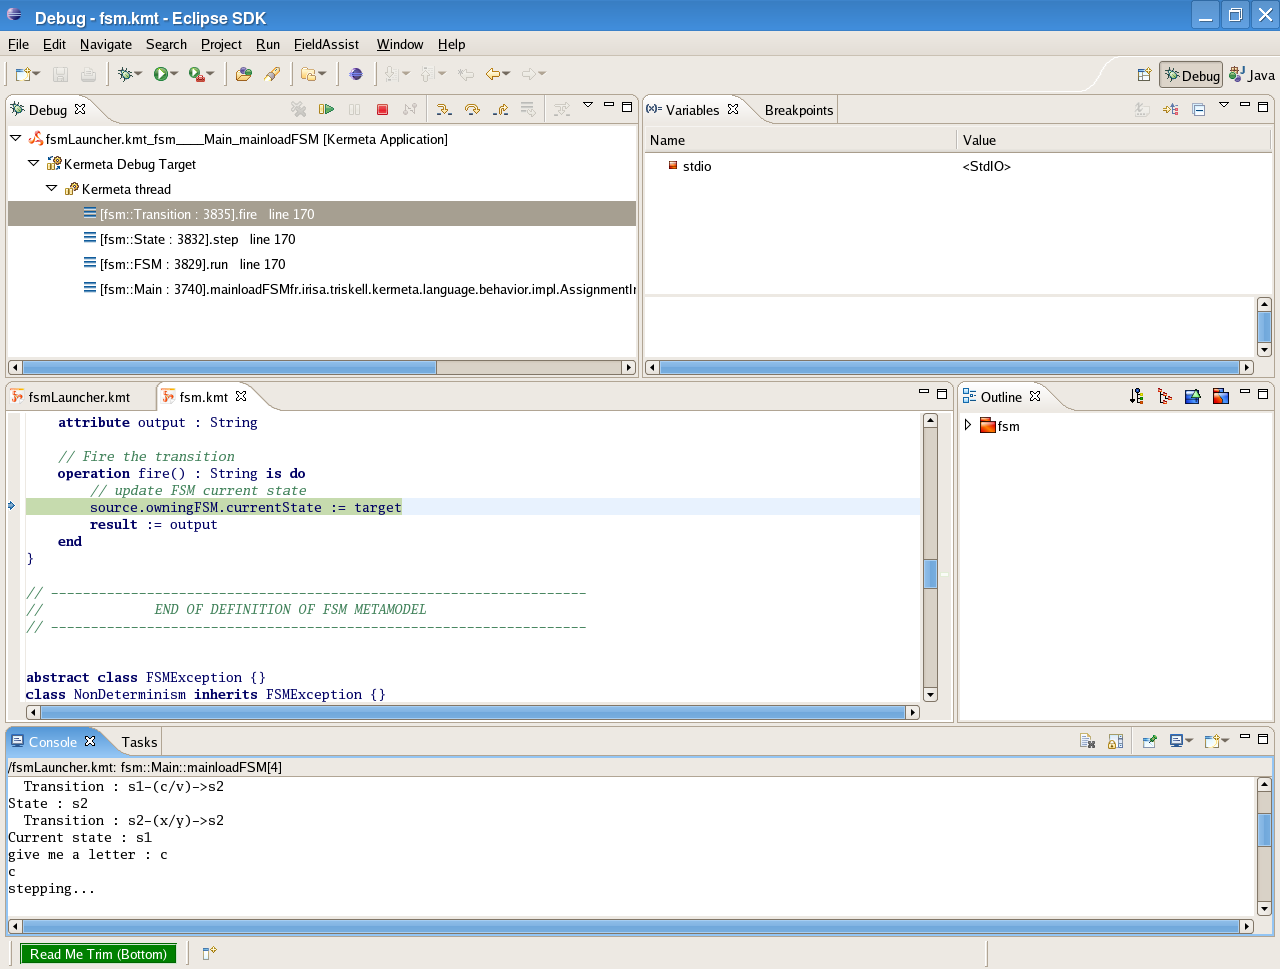
A debugger offers users the possibility to interpret Kermeta's programs step by step, or stopping programs at one moment to check the the programs' state. Above you can see the global view of the editor.
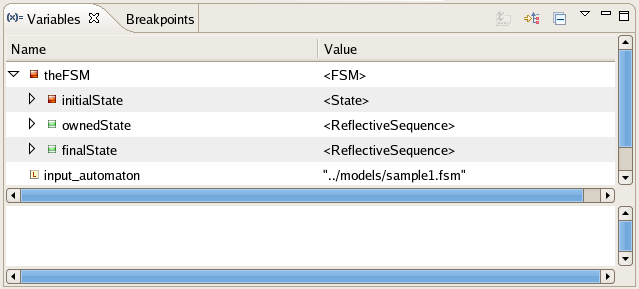
During programs execution, you may want to know variables' values. For that purpose, you can use the watch view which displays all the variables accessible in the current context and their values. Moreover you can browse those variables to have a deeper look inside variables.
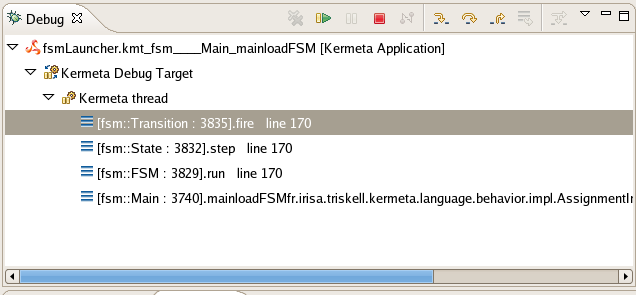
A frame is a context environment for a call method. That means that for each method call, you have access to its context that is to say the variables values. Obviously, it is strongly related to the watch view. Clicking on one frame modifies the watch view. The frame view is also nice to follow the execution. For instance, in the figure above, we know that the run method has called the step method which has called the fire method.
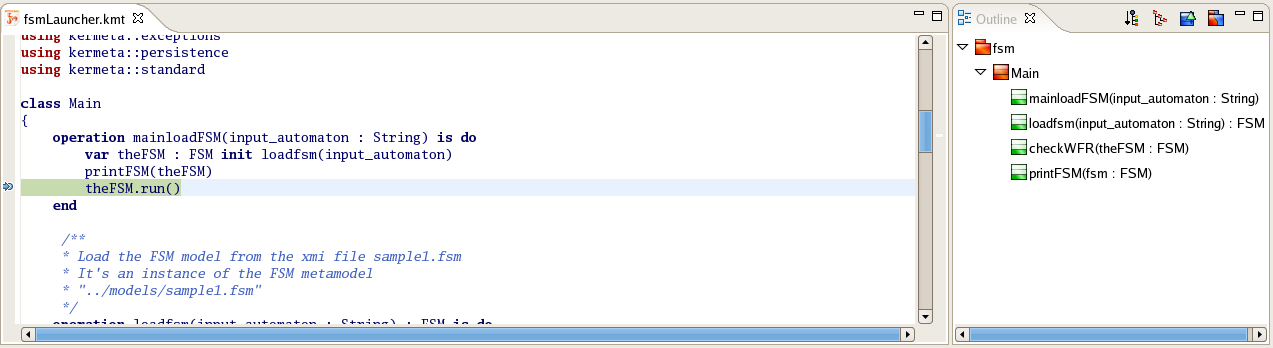
When debugging, you surely want to know which line of code is executed. That is the reason why the Kermeta text editor is displayed with the outline. The current line of code is colored in green as in the following figure. This green line is moving to the next instruction depending your action.
There are three kind of actions you can execute:
F5 : pressing the F5 key makes the debugger entering in the current operation.
F6 : pressing the F6 key makes the debugger stepping to the next operation.
F8 : pressing the F8 key makes the debugger executing all the operations to the next breakpoint, if there is some one.
![[Note]](gfx/admonitions/note.gif) | Note |
|---|---|
A nice feature is that you can add or remove breakpoints to your Kermeta file during debugging. |